Menu Cost Analysis for Restaurants
FrillPick lists every dish with its cost, menu price, food cost % and profit per plate, flags the ones over your target, and shows how each recipe's cost moves as your vendor prices change. Costs come from the price sheets you already download from your vendors.
$20/month after a 14-day free trial · no sales data needed · see pricing
A menu cost analysis answers one question for every dish: what does it cost to make, and what's left after you sell it? Most kitchens work that out once, when the dish goes on the menu, and then vendor prices keep moving. FrillPick keeps the answer current by costing every recipe from the price sheets you upload from your vendors. It also lets you cost test new menu ideas: build the recipe, see what it costs and what to charge, before it ever goes on the menu.
What a Menu Cost Analysis Shows
For each dish you need four numbers:
- Cost per serving: what the ingredients on one plate cost you.
- Menu price: what you charge.
- Food cost %: cost per serving ÷ menu price × 100.
- Profit per plate: menu price − cost per serving, before labor and overhead.
An example, with made-up numbers: a burger costs $4.20 to plate and sells for $14.00.
| Example burger | Cost per serving | Menu price | Food cost % | Profit per plate |
|---|---|---|---|---|
| When it went on the menu | $4.20 | $14.00 | 30.0% | $9.80 |
| After beef and buns go up | $4.80 | $14.00 | 34.3% | $9.20 |
Same dish, same price, 60 cents less on every plate. Nobody changed anything in the kitchen; the vendor did. That's the change a menu cost analysis exists to catch.
How FrillPick Does It
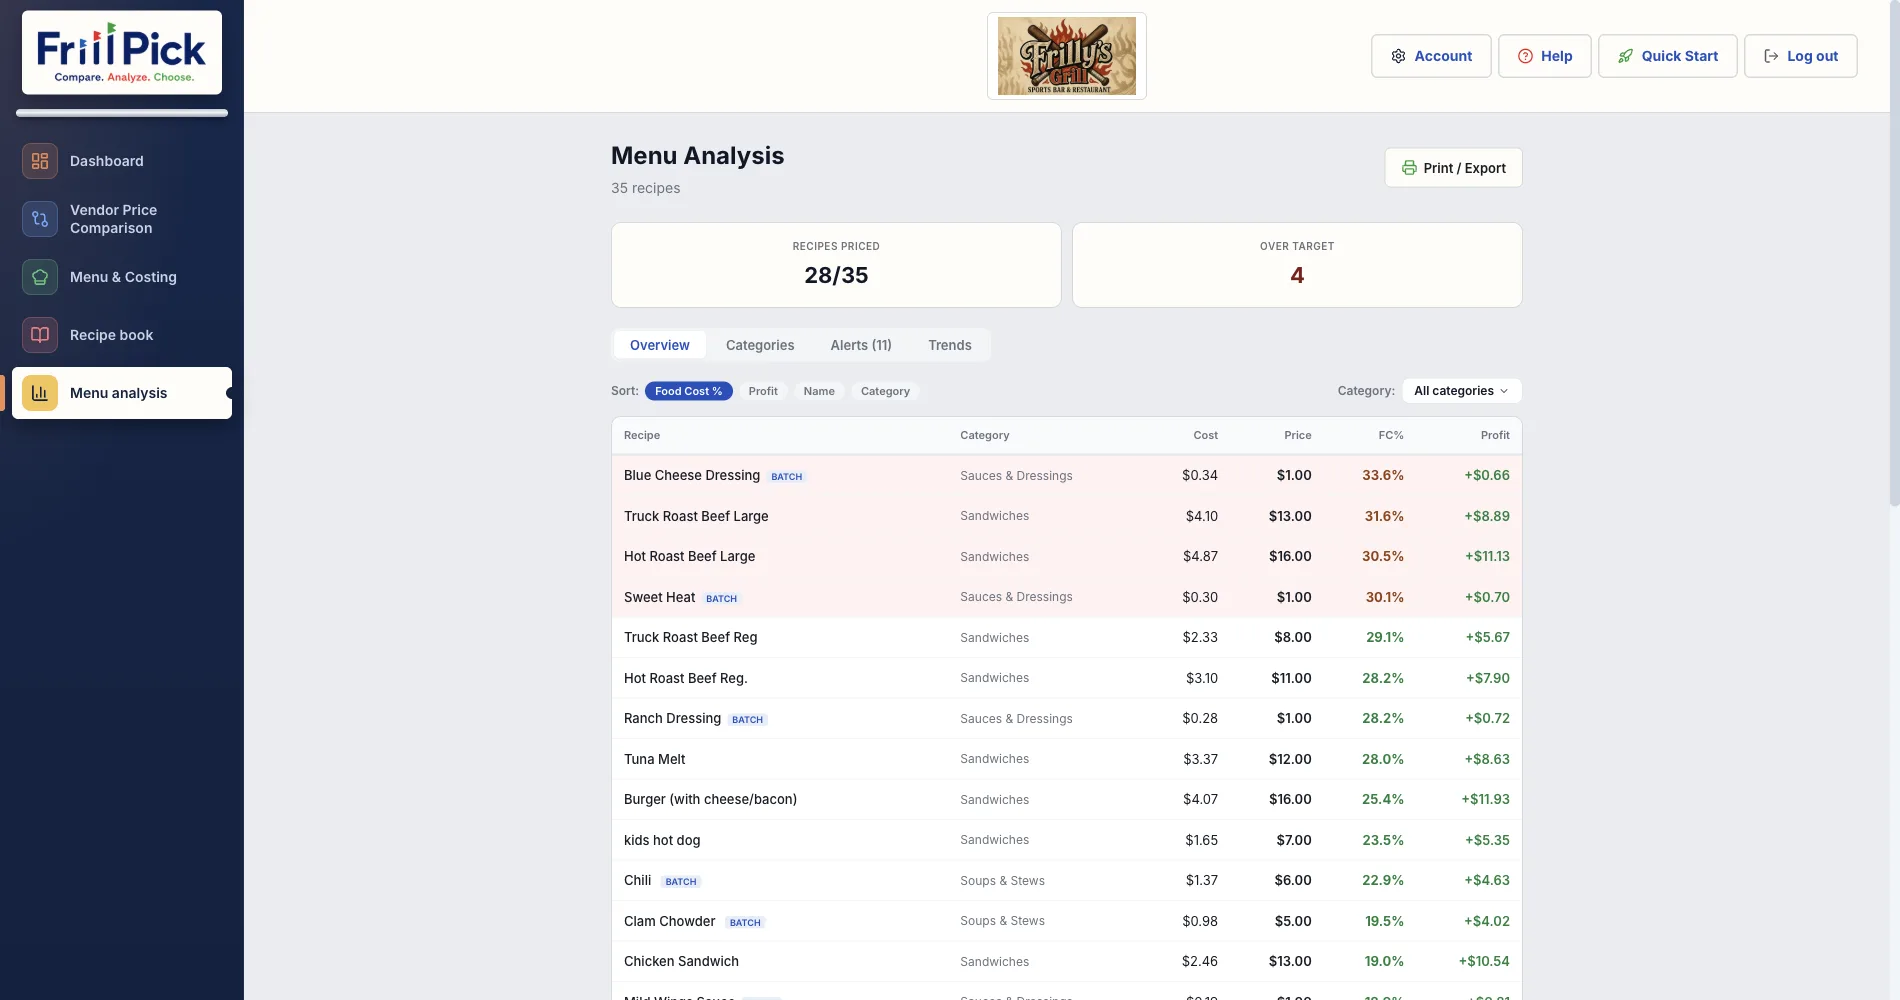
Menu analysis in FrillPick reads the same recipe costs you build in Menu & Costing, so the numbers match the recipe screen, printouts and exports. You get:
- Every dish in one list with its cost, menu price, food cost % and profit, sorted by food cost %, profit, name or category, and filtered by category.
- Your target, per recipe. Set a target food cost % on each recipe (30% if you don't). Dishes over target are highlighted.
- Alerts for dishes over target, dishes with no menu price set, and recipes with no ingredients.
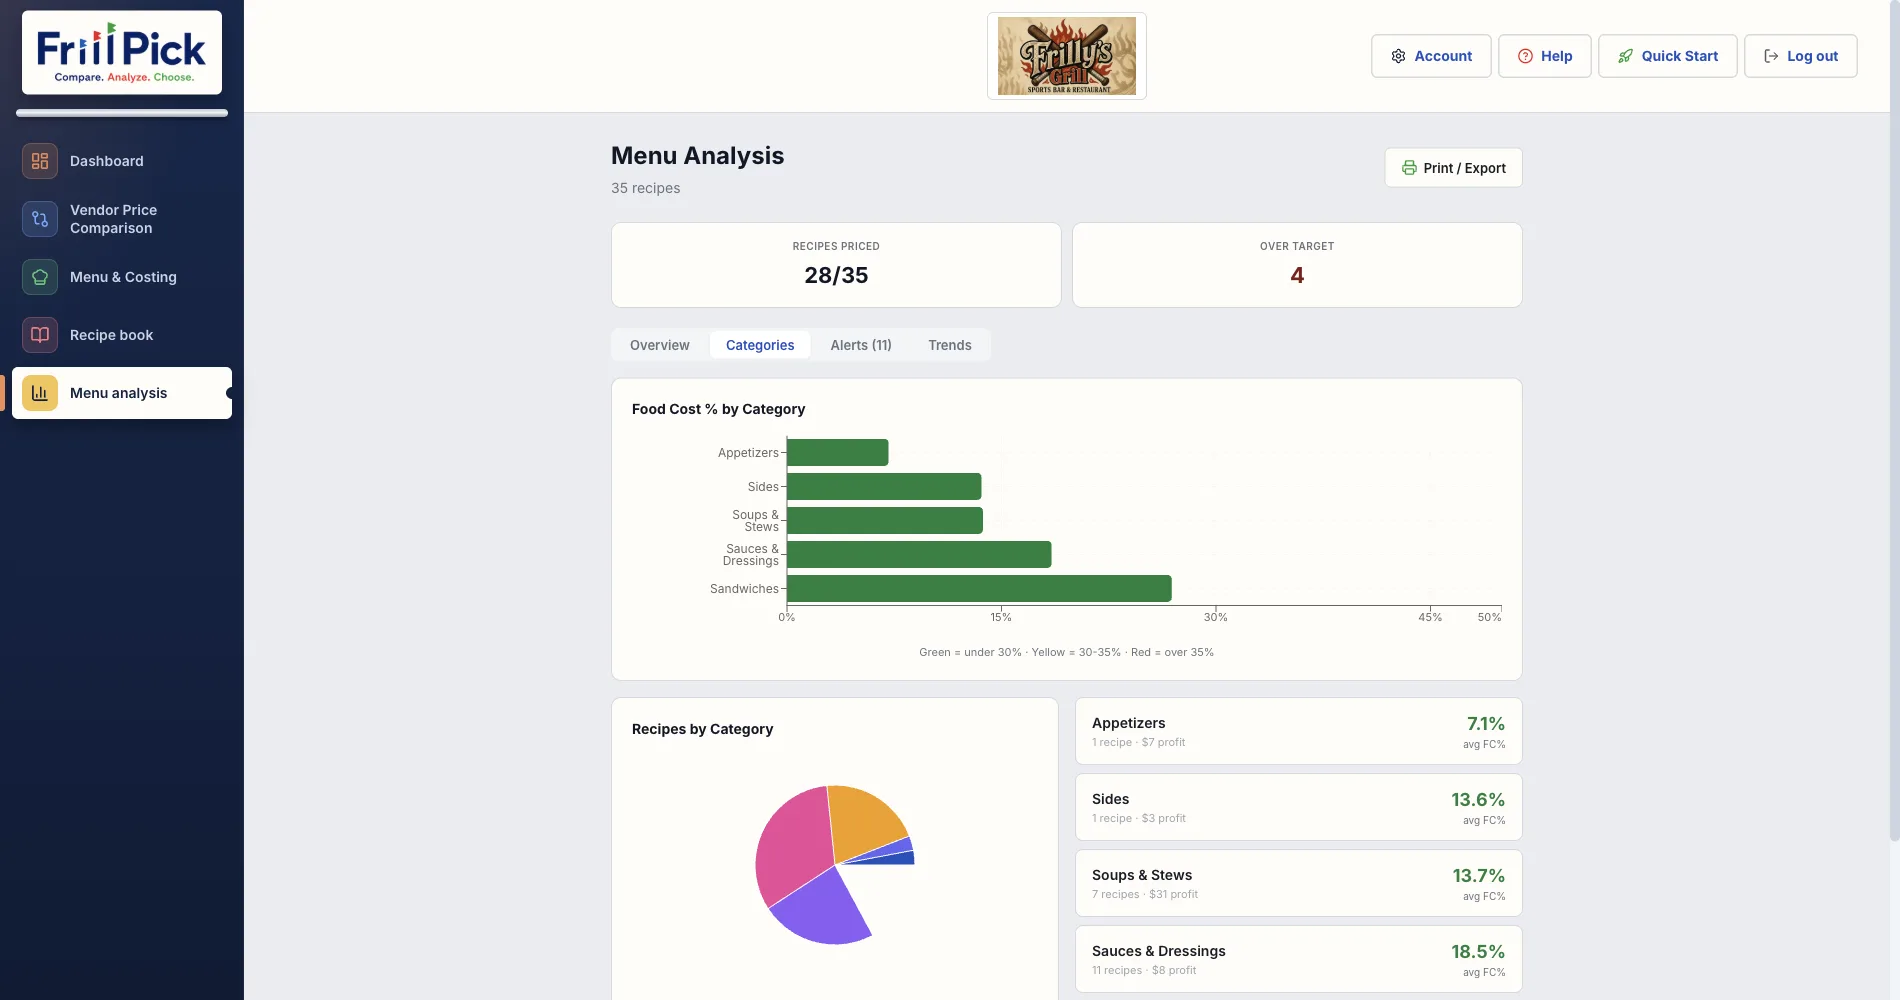
- Categories: average food cost % for each menu category, so you can see whether it's the appetizers or the entrees running high.
- Nothing hidden. If a dish uses an ingredient FrillPick couldn't cost, or a last known price because the current sheet had none, the dish says so.
Track Cost Changes as Prices Move
When a new price sheet changes an item's price, FrillPick keeps a record of the old one. The Trends tab uses that history to chart each recipe's cost over time, with the biggest increases first. Switch between the dollar cost and food cost %; the food cost % line uses today's menu price, so it shows what the price changes did to your margin.
Trends build up as you re-import. A recipe whose ingredients haven't changed price yet sits under "Not enough history yet" until they do.
Menu engineering sorts dishes by how much each one earns and how often it sells. FrillPick doesn't use your sales numbers, so it covers the first half: what each plate costs and earns. Pair it with your POS sales report to see which dishes make you the most money overall.
Print or Export It
Print the analysis, or save it as a PDF, Word, text or Excel file. The export follows what's on screen, so filter to one category or sort by profit first and that's what you get.
What You Need
- Your vendor price sheets as CSV or Excel files, downloaded from your vendor's ordering site.
- Your recipes, costed in Menu & Costing. See how that works on the recipe costing software page.
- Your menu prices, entered on each recipe.
See What Every Dish Really Costs
Upload your vendor price sheets, cost your recipes, and see food cost % and profit for your whole menu, kept current as prices change.
Start Free Trial14-day free trial, then $20/month · Works with any distributor CSV or Excel file
Frequently Asked Questions
What is a menu cost analysis?
A list of every dish on your menu with what it costs to make, what you charge, its food cost percentage and the profit it leaves per plate. It shows which dishes are priced too low for what goes into them.
How do you calculate food cost percentage for a dish?
Divide the cost of one serving by its menu price and multiply by 100. A dish that costs $4.20 to make and sells for $14.00 runs a 30% food cost.
Is FrillPick menu engineering software?
No. Menu engineering also needs how many of each dish you sell, and FrillPick doesn't use your sales numbers. It shows what each plate costs and earns, and how that changes as your vendor prices move.
How does FrillPick know when a dish's cost goes up?
Each recipe is costed from the price sheets you download from your vendors. When you upload a new sheet, every recipe using those items is re-costed, and the Trends tab shows how each recipe's cost has moved across your uploads.
Can I export my menu analysis?
Yes. Print it, or save it as a PDF, Word, text or Excel file. The export follows the category and sort you have on screen.
How much does FrillPick cost?
$20 a month after a 14-day free trial. One plan includes menu analysis, recipe costing, the Recipe Book and vendor price comparison.
About the author: Chris is an independent restaurant owner and the founder of FrillPick, a price comparison, menu costing and recipe tool built for fellow operators.